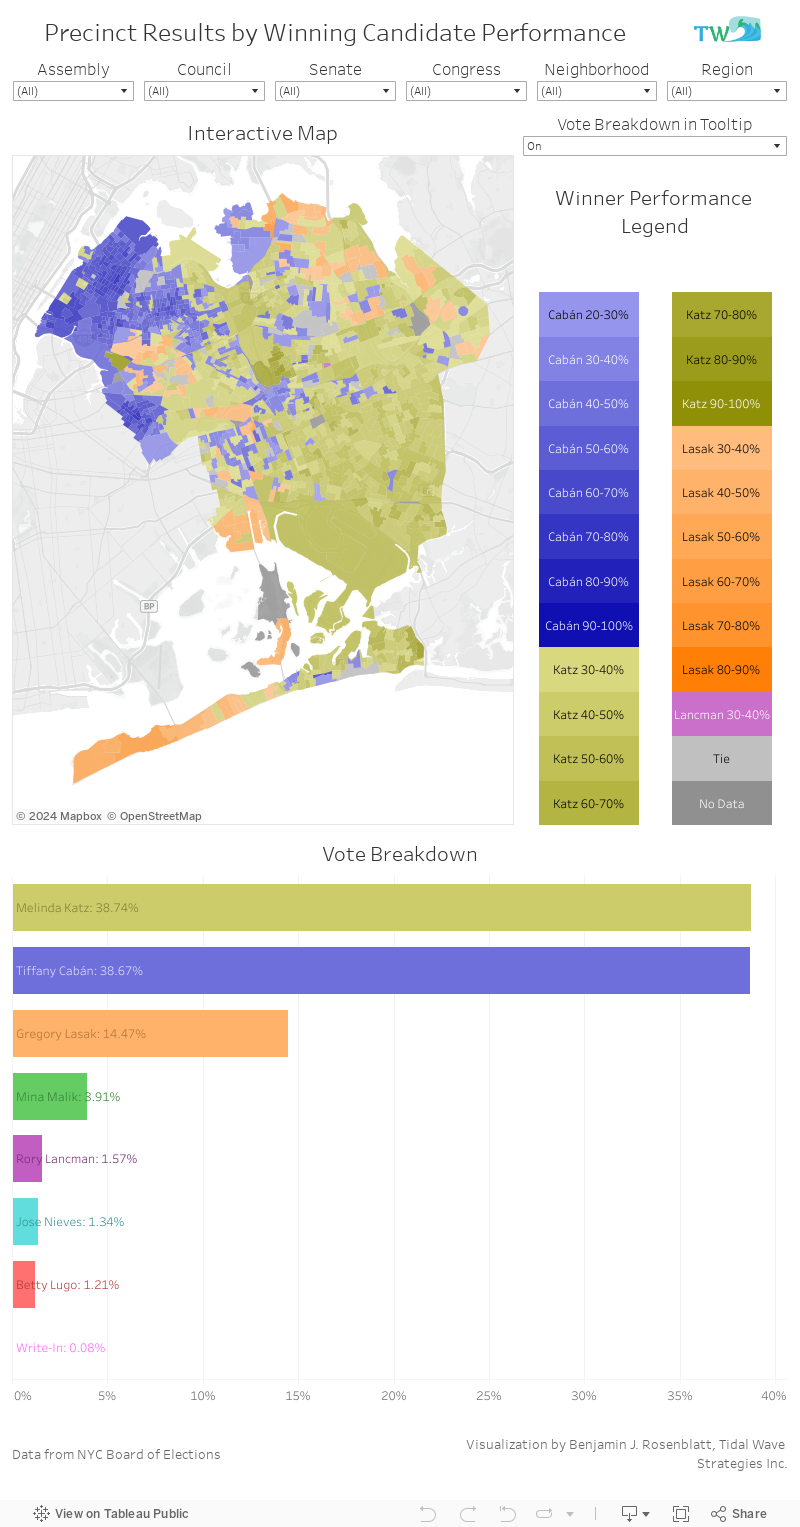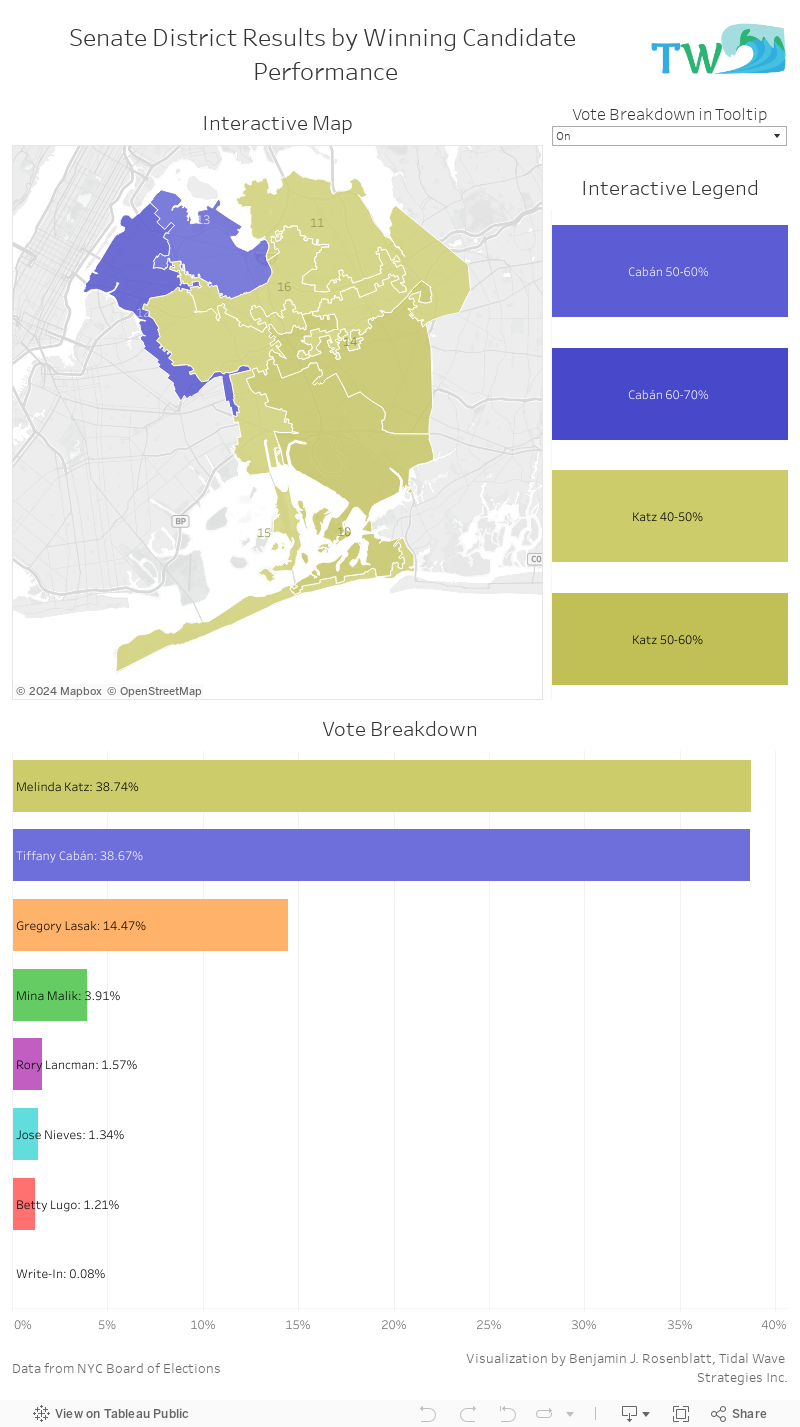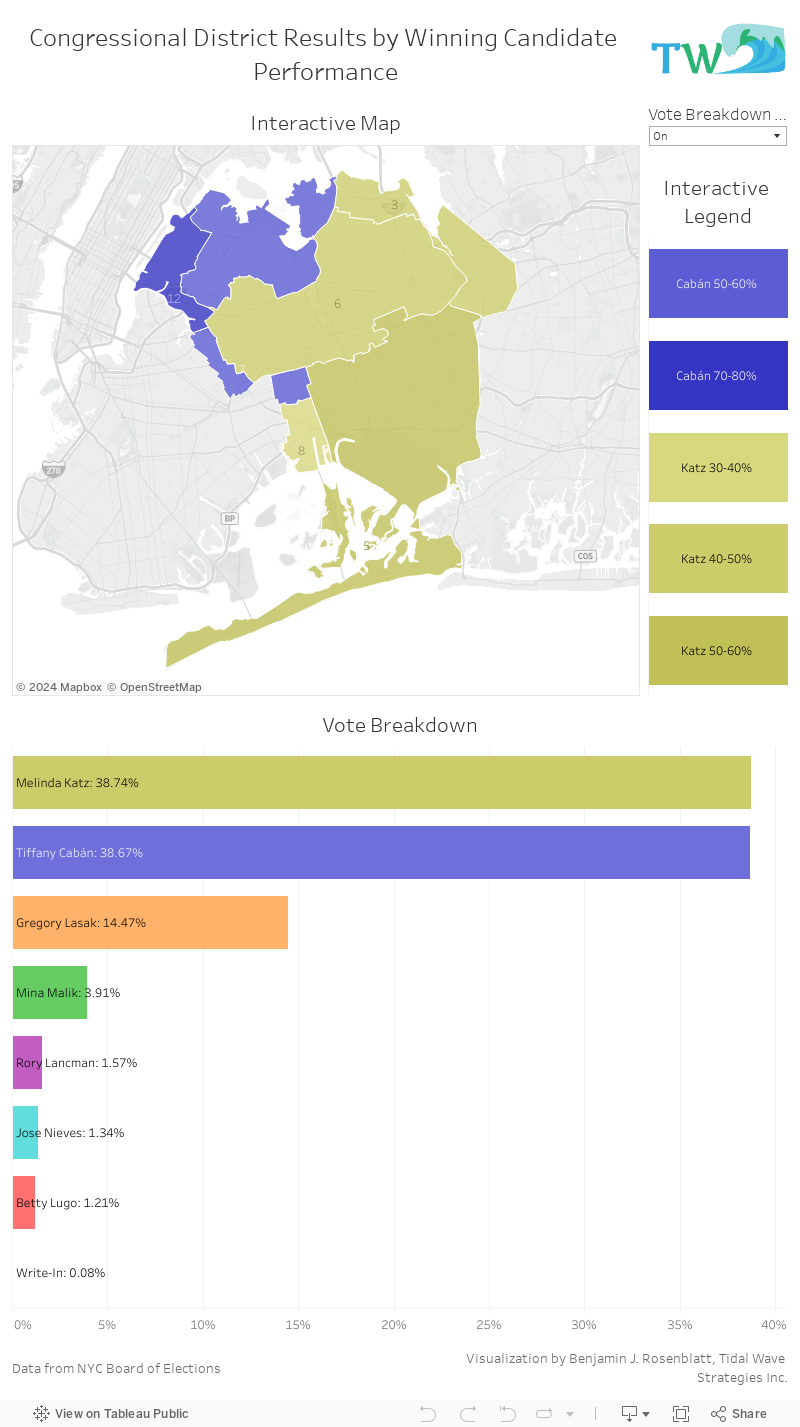
Interactive results from the Democratic Primary for Queens District Attorney
/Now that the results in the Queens District Attorney Democratic Primary are final, the Queens Daily Eagle, partnering with Benjamin Rosenblatt of Tidal Wave Strategies, has created updated interactive results dashboards.
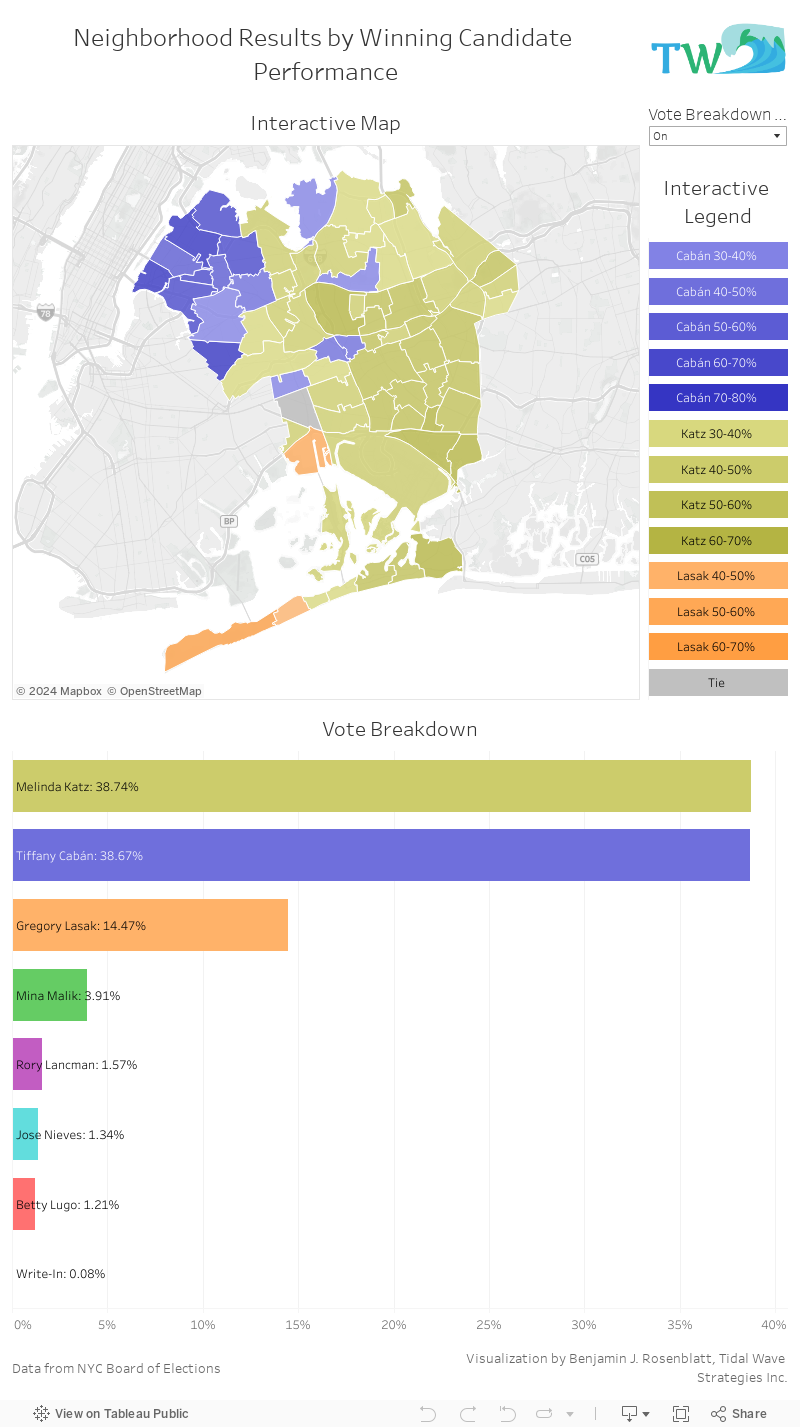
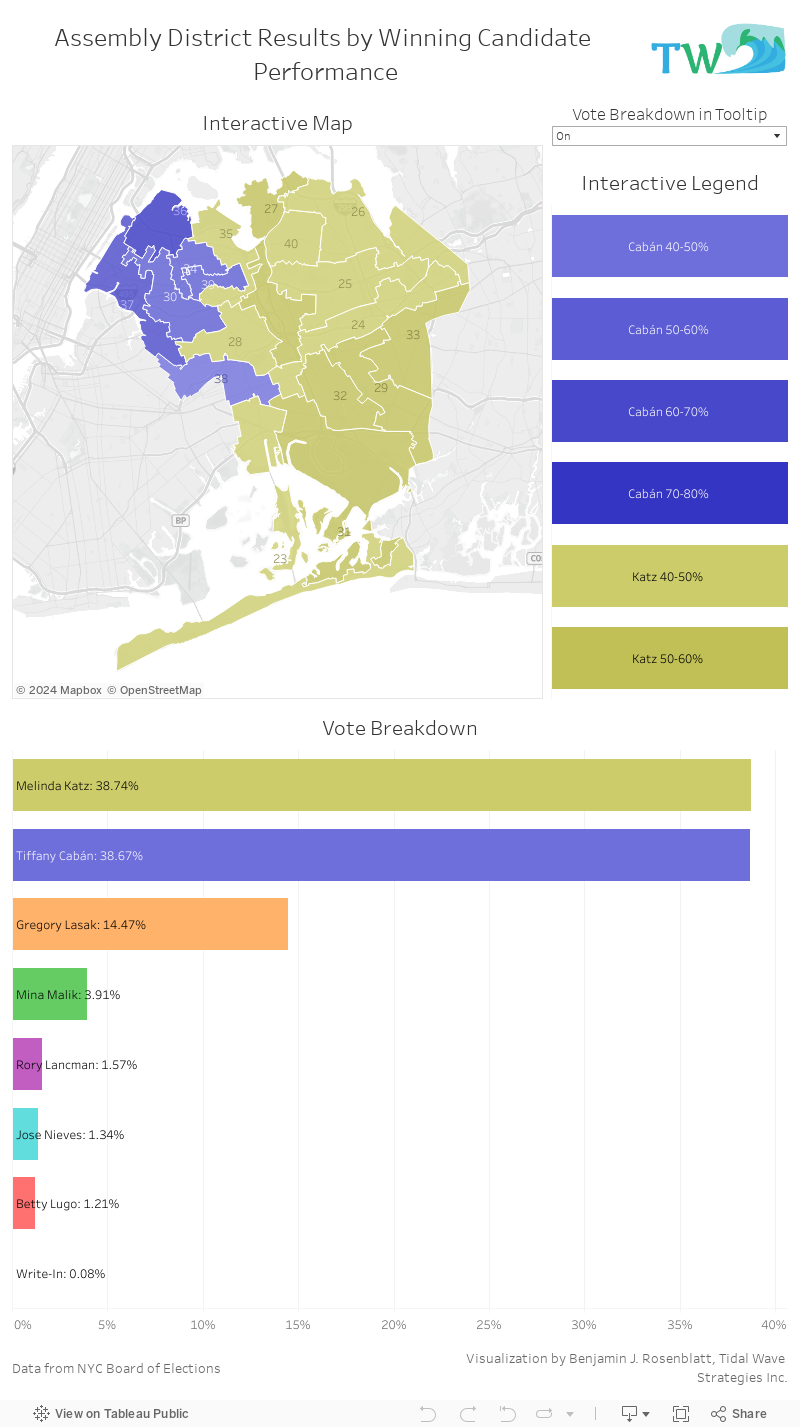
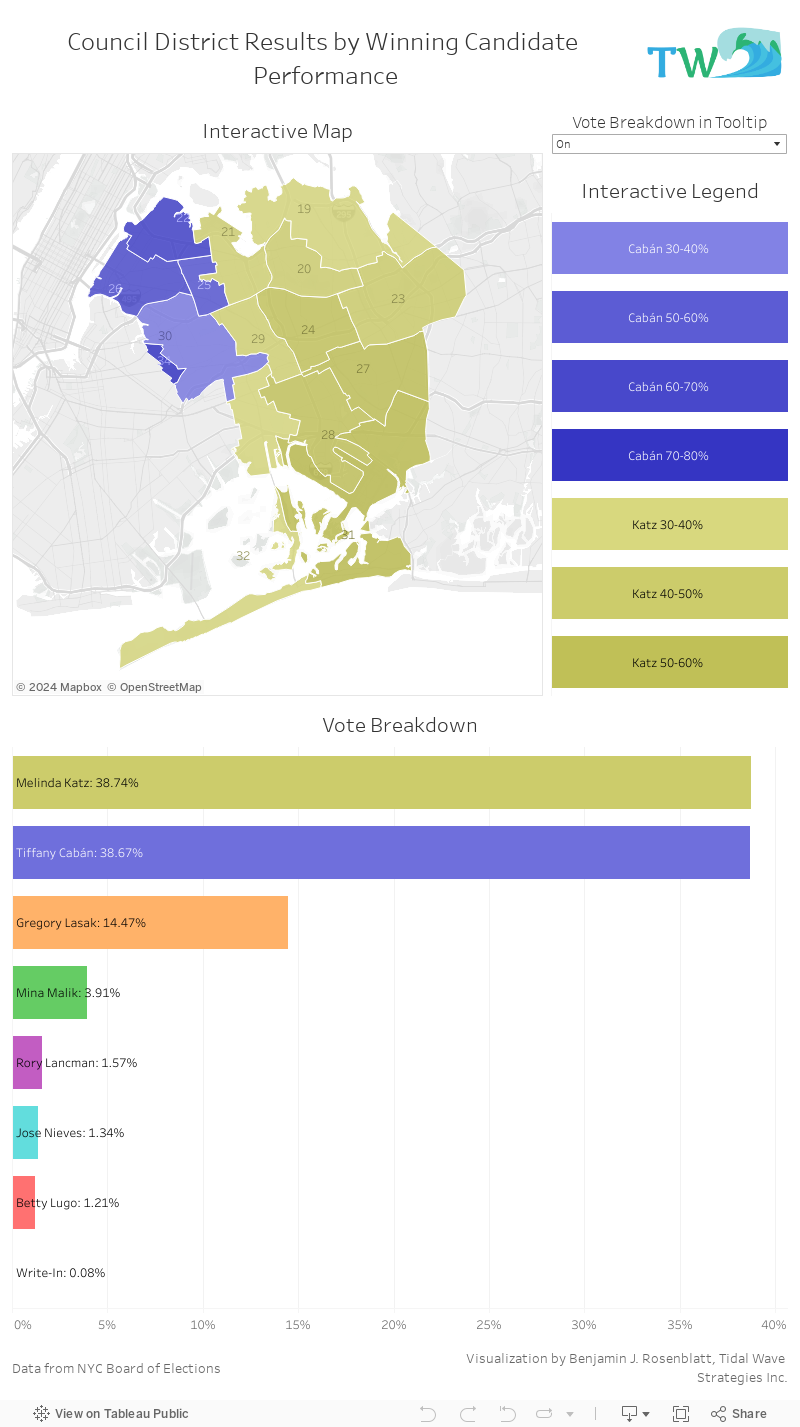
These dashboards show the winning candidate’s performance by Election District (precinct), Neighborhood, State Assembly District, City Council District, State Senate District, and Congressional District. Hovering or clicking on any district will provide users with a vote breakdown for every candidate in the primary in that district. Clicking on any box in the interactive legend will update the map and the overall vote breakdown bar accordingly. You have the option to turn this feature off or on with the “Vote Breakdown in Tooltip” dropdown.
In the Election District/Precinct dashboard, users can use filters to show or hide specific Assembly, Council, Senate, and Congressional Districts, as well as Neighborhoods and Regions. The precinct map, interactive legend, and overall vote breakdown bar will all update accordingly.
Please note that these maps show the post-recount results, the most recent publicly available results from the NYC Board of Elections, and are therefore off from the final total after court challenges by a 5 vote margin.
Tidal Wave Strategies has also put together a variety of other relevant interactive dashboards, including turnout, individual candidate performance, and more at each of the district or neighborhood levels provided here. To see those dashboards, click here or go to tidalwavestrategies.com/Elections/QueensDA.